Office Performance Based Test
Select One from Each Program Covered in Office (Word, Excel, and PowerPoint) Create a new Folder in your Google Drive folder of work called Final and save each project into the folder. Save as Final and the Program and the Number. So for example, number 2 from the Word section below would be saved as FinalWord2 in the Final folder.
Word (select one number from below, if
there are 2 letter parts, do both)
1. Flyers
a. Design and create a property advertisement flyer: As a part time employee of Markum Realty, you have been assigned the task of preparing a flyer advertising lakefront property. The headline should read: Lakefront Lot. The first paragraph of text should read as follows: Build the house of your dreams or a weekend getaway on this beautiful lakeside property on the north side of Lake Pleasant. Insert a photograph that is appropriate (may be found on the internet). Include the following info: City sewer and water available, Lot size 110 x 300; List price $65,000. Call Markum Realty at 555-0995 for a tour! Use the concepts and techniques that you learned in Word to create and format this flyer.
b. Design and create a flyer for the sale of a business: After 25 years, your Uncle Mitch has decided to sell his ice cream shop and wants you to help him create a sales flyer. The shop is in a choice location at the corner of 135th and Main Street and has an established customer base. The building has an adjacent, paved parking lot, as well as an outdoor seating area. He wants to sell the store and all its contents, including the equipment, tables, booths, and chairs. The 1200 square foot shop recently was appraised at $200,000, and your uncle is willing to sell for cash or on contract. Use the concepts and techniques that you learned in Word to create a sales flyer. Include a headline, descriptive body copy, a signature line, an appropriate photograph or clip art image, a bulleted list, a decorative underline, and a page border.
2. Research Paper
Did you ever wonder what world events took place during the month and year you were born? For example, what happened with respect to politics, world affairs, and the economy? What made headline news? What was on television and at the box office? Were any famous people born? What songs topped the charts? What was happening in the world of sports? Research the newsworthy events that took place during the month and year (i.e., July 1981) by searching the Web. Write a short research paper(450-500 words) that summarizes your findings. Include at least two references(in text citations) and one explanatory (foot) note. Use MLA style and the format learned in the class(footnote and in text citations inserted using references tab) Works Cited Page inserted using References tab.
3. Cover Letter
Joe Smith has written the letter below but it is very boring and will probably not get the attention of the Human Resources Department. Joe's phone number is 215-222-5555 and email is joesmith@gmail.com. Include a line below his information.
Rewrite Joe's letter with a letterhead and proper formatting. Spacing should be the same as letters in Word Ch 3. Use a shape for his name with a gradient fill. Include an image in his letterhead (flip to include the mirror on the opposite side). Include left tab stops for the date, closing and signature lines at 4".
Excel (select
one number from below, if there are 2 letter parts, do both)
1.
a. Design and create a worksheet and chart to analyze a budget: To estimate the funds needed by your school’s Environmental Club to make it through the upcoming year, you decide to create a budget for the club by itemizing the expected quarterly expenses. The anticipated expenses are listed in the table below. Use the concepts learned in Excel to create the worksheet and an embedded 3-D Column chart using an appropriate chart style that compares the quarterly cost of each expense. Include totals for both the columns and rows. Use a formula to determine the average amount spent per quarter on each expense. Insert the averages with appropriate titles in the worksheet. Include a table title and subtitle. Format the table.
|
|
Jan-Mar |
April-June |
July-Sept |
Oct-Dec |
|
Meeting Room Rent |
300 |
300 |
150 |
450 |
|
Copies and Supplies |
390 |
725 |
325 |
640 |
|
Travel |
450 |
755 |
275 |
850 |
|
Refreshments |
105 |
85 |
215 |
155 |
|
Speaker Fees |
200 |
200 |
0 |
500 |
|
Miscellaneous |
125 |
110 |
75 |
215 |
b. Problem: You are the CFO for a
software training company. You want to track the income from the five classes
(Word, Excel, Access, PowerPoint, and Windows XP) offered at four different
training sites by your company. Your worksheet will show the course name in the
first column and the revenue from the training sites (Hobart, Lake Station,
Crown Point, and Merrillville) in the other columns, as shown in Table E1A-1.
Instructions: Use the data provided in Table E1A-1.
·
Using the data in Table E1A-1, create the
worksheet shown in Figure E1A-1.
·
Use AutoSum to create the total revenue for each
of the four training sites and the totals for each of the five training classes.
·
Format the worksheet title, Computer Training
Revenue, as Heading 1 style, and centered across columns A through F.
·
Using AutoFormat on the Format menu, format the
range A2:F2 using the Heading 3 style. Use appropriate styles to format the remaining
cells so the worksheet displays as shown in Figure E1A-1.
·
Use the Chart Wizard button to add the 3-D
Clustered column chart shown on the worksheet in Figure E1A-1.
·
Enter your own name in cell A23. In the cells
directly below your name, enter your course identification(Office1), the assignment
name (Excel1B), the date, and your instructor’s name.
· Save the workbook using the file name, Excel1B.
·
Change the revenue for the Word training in
Hobart to 16,538. Decrease revenue for Excel in Lake Station to 7,787 and
Access revenue in Lake Station to 3,945. Increase the PowerPoint revenue in
Crown Point to 8,493. Decrease the revenue for Windows classes in Crown Point
to 7,858. The training site totals will be: Hobart – $60,430.00, Lake Station –
$34,251.00, Crown Point – $41,468.00, and Merrillville – $39,605.00. Close the
workbook and save the changes.
|
Computer Training
Revenue |
|||||
|
Packages |
Hobart |
Lake Station |
Crown Point |
Merrillville |
Totals |
|
Word |
15,653 |
5,896 |
7,563 |
8,433 |
|
|
Excel |
14,645 |
8,123 |
9,456 |
8,561 |
|
|
Access |
9,894 |
4,430 |
8,098 |
6,809 |
|
|
PowerPoint |
9,908 |
7,324 |
7,943 |
7,893 |
|
|
Windows XP |
9,445 |
9,299 |
8,980 |
7,909 |
|
|
Totals |
|
|
|
|
|
Table E1A - 1

Figure E1A -
1
2. Create a fund-raising analysis worksheet: You are the chairperson of the fund-raising committee for a local charity. You want to compare various fund-raising ideas to determine which will give you the best profit. The data obtained from six businesses about their products and the format of the desired report are shown in the table below. The required formulas are shown in the formulas table. Use the concepts from Excel to create and format the worksheet. Create a chart to show the most profitable fund raiser with 2000 Sales and another chart to show the most profitable with 5000 Sales. Place each chart in a new worksheet. Include a title and subtitle. Format the table, sheet tabs, and charts.
|
Product |
Company |
Cost Per Unit |
Margin |
Selling Price |
Profit Per 2000 Sales |
Profit Per 5000 Sales |
|
Candles |
Woodland Farms |
$4.75 |
40% |
Formula A |
Formula B |
Formula C |
|
Candy |
Polkandy |
3.00 |
70% |
|
|
|
|
Coffee |
Garcia Coffee |
6.50 |
45% |
|
|
|
|
Cookie Dough |
Oh, Dough! |
2.90 |
65% |
|
|
|
|
Flower Bulbs |
Early Bloom |
2.40 |
50% |
|
|
|
|
T-shirts |
Zed’s Sports |
5.75 |
42% |
|
|
|
|
Minimum |
|
Formula D |
|
|
|
|
|
Maximum |
|
Formula E |
|
|
|
|
|
Formula A = Cost per Unit / (1-Margin) |
|
Formula B = 2000 * (Selling Price – Cost per Unit) |
|
Formula C = 5000 * 110%*(Selling Price –Cost Per Unit) |
|
Formula D = MIN function |
|
Formula E = MAX function |
3. Cousin Abe and Aunt Ester own a paint company. Their good friend Billie Bob is retiring after 35 years of delivering the morning newspaper. Billie Bob has offered them the opportunity to take his place next year. The job requires, however, that they own a truck. They need to save enough money over the next six months to buy a $10,000 used truck. They have job orders at their paint company for the next six months: $22,150 in July, $22,480 in August, $32,900 in September, $31,200 in October, $45,301 in November, and $32,190 in December. Each month, they spend 34.55% of the job order income on material, 3.00% on rollers and brushes, 4.75% on their retirement account, and 39.5% on food and clothing. The remaining profits (orders-total expenses) will be put aside for the used truck. Aunt Ester’s retired parents have agreed to provide a bonus of $250 whenever the monthly profit exceeds $2,000. Cousin Abe asked you to create a worksheet that shows orders, expenses, profits, bonuses, and savings, for the next six months, and totals for each category.
PowerPoint (select one from below)
1.
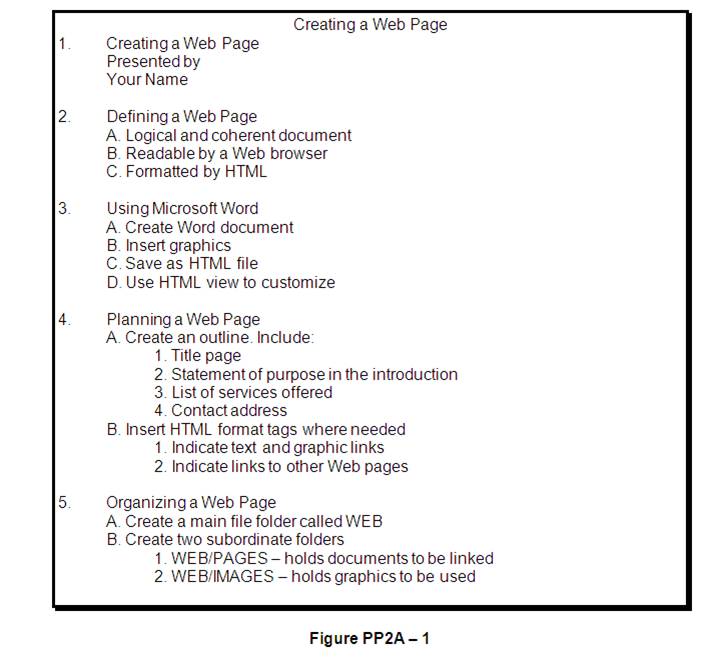
Creating
a Presentation with Illustrations and Shapes
Problem: You work for Southeast Computer Services and have just been contracted to assist a very large client in the development of Web pages. Various departments within your client's organization will create the Web pages. Your assignment is to present training courses for the client on how to create Web pages. (Note: Requested clip art files may be replaced with substitutes found on the web.)
Instructions: Perform the following tasks.
·
Use the
outline in Figure PP2A – 1 to create slides for your presentation.
·
Change the
background style to Style 7 from Variants on the Design ribbon.
·
Check
the spelling of your presentation and switch to Normal view.
·
Add Push From Left transition to slide 1 and 4.
·
On Slide
2, change the slide layout to Two Content. Insert a computer clip art file on
the right. Make it Fly In. Put the text on the left. Add Dissolve transition to Slide 2 and 5.
· On Slide 3, change the slide layout to Two Content. Insert a person clip art file on the left. Make it Teeter. Put the text on the right.
·
On Slide
5, change the slide layout to Two Content. Insert a folder clip art file on the
left. Make it Shrink and Turn. Put the text on the right.
·
Insert a
new Slide after Slide 5 using slide layout Picture with Caption. Insert picture
SampleWebPage.bmp. Add caption of “Sample Web
Page” to the slide. Format the caption with Fill: Orange, Accent Color 2; Outline: Orange, Accent Color 2 from the Format group on the Home ribbon. Change the font size to 36.
·
Apply
Shape Style –Intense Effect, Orange Accent 2 to the titles of slides 2, 3, and 5.
Change the heading font to Cambria and the color to Dark Blue, Accent 5, Darker
25% for the titles as well.
·
Change
the font of Slide 1 title text to Cambria and the font color to Dark Blue, Accent 5, Darker 25%. Increase the font size to 60.
·
Save the
presentation on your Z drive using the file name, FinalPowerPoint1
2.
Creating
a Presentation with Custom Backgrounds and SmartArt Diagrams
Problem: You are a dietician at a local health center that is offering a free seminar on fast- food fat content. Many of the attendees are recent heart attack patients, and you want to stress the importance of reducing fat in their diets. Your agenda includes comparing the fat content of the top three fast-food restaurants’ menus. You decide you can best do this comparison by creating a table. An outline of your presentation already has been prepared in Microsoft Word and saved in rich text format.
Instructions: Perform the following tasks:
·
Start
PowerPoint and open the existing presentation outline, Defatting Your Life.rtf,
click here for file. Include your
name as the presenter on the title slide.
·
Change
the document theme to Retrospect. Format the background using texture Blue tissue
paper.
· On Slide 1, apply WordArt style – Fill: Brown, Accent Color 3; Sharp Bevel to the title text. Change the font size to 66.
·
On Slide
2, change the layout to Two Content and insert an appropriate food-related clip
art file. Resize it as necessary.
·
On Slide
5, change the layout to Two Content and insert another food-related clip art
file. Change the Shape Fill color to yellow.
·
On Slide
6, change each bulleted list font size to 24.
Make other slide adjustments if necessary.
·
Check
the spelling of your presentation.
·
After
Slide 2, add a slide. Create a SmartArt organization chart - Heirarchy Organization Chart. Apply Cartoon SmartArt style to the chart. Delete the 3 sub
bullets from Slide 2 (Polyunsaturated, Monounsaturated, and Saturated). Enter Dietary Fats at the top of the SmartArt
·
Apply
the Checkerboard From Top transition to all slides.
·
Save the
presentation on your Z Drive using the file name, FinalPowerPoint2
3.
Design and Create a Gods and Goddesses
Presentation: People have worshipped gods and goddesses since prehistoric times,
thinking these spirits affect the destinies if humans and nature. These deities
are believed to control forces beyond human power, and the rituals associated
with worshipping them have held societies together. Some of these figures
resemble humans, while others have part-human or part-animal forms. Many of the
Roman gods are equivalent to earlier Greek versions, and their names and roles
are listed in the table below. Create a presentation about gods and goddesses;
include the information and table provided here as well as your Internet
research. At a minimum include 1 slide for each role below. Apply a table style
and border. Use pictures and graphics and add formatting. Apply slide transitions
and animations to enhance your presentation. Add a footer with page numbers and your name on all slides.
|
Role |
Greek
Name |
Roman
Name |
|
Goddess
of Love |
Aphrodite |
Venus |
|
God
of the arts and Medicine |
Apollo |
Apollo |
|
God
of War |
Ares |
Mars |
|
God
of Travel, roads and Trade |
Hermes |
Mercury |
|
God
of the Sea |
Poseidon |
Neptune |
|
Queen
of the Gods |
Hera |
Juno |
|
Ruler
of the Gods |
Zeus |
Jupiter |